Introduction
The variables of interest to me are voting intentions and government spending, which fall under the same dataset. Voting and government spending correlate because people are influenced to exercise their political rights when the state allocates funds for social development. State spending is experienced in various sectors, including education, health, and infrastructure. The government spends on resources to address social issues. For example, states may hire more nurses to assist in offering medical care services. Voting intentions depend on how the state resolves basic needs, such as medical issues.
Categories that can be formulated from the people’s voting intentions include whether one is likely to vote, not certain, or unlikely. Different values can be drafted from the variable to determine its significance with respect to government spending. Increasing government spending influences people to vote because state residents can meet their needs through elected persons. Voting intents are evident from the parties associated with government representatives who foster change. For instance, if democrats advocate for allocating more funds for infrastructure, they will possibly gain more votes.
Government spending can be analyzed on an ordinal scale that helps identify the corresponding values. Ordinal levels include average, high, or less spending within a state, as depicted from the class codebook. The state government determines its spending based on the revenue collected from companies and individual incomes. Substantive correlations between government spending and voting can be further explained through theoretical perspectives.
Theoretical Expectation
The identified variables have a causal relationship, whereby one factor directly impacts the other. The increase in government spending leads to high turnouts for voting exercises. States are likely to realize a high number of registered voters when social improvements are executed. The causal connection is evident because government spending is the primary cause for voting. Changes in state expenditures impact citizens’ motives to vote, implying that the outcomes rely on one variable. The hypothesis for the causal correlation is that government spending positively influences the people to vote.
The relationship’s mechanism outlines that residents will value the need to vote when the state intensively invests in resource allocation to the less developed regions. State developments are enhanced through political actions, whereby elected persons push for interventions that resolve society’s wants. Therefore, politicians’ roles encompass fostering their state’s growth and eliminating prevalent issues. People expect that when their most preferred individual holds a position in Congress or other significant settings, they will be prioritized in education, health, and other social matters. The public evaluates contributions of their representatives through the changes within the state. Minimal developments lead to low-performance scores based on the public’s views. Optimal advancements also cause the public to highly value their politicians as they show the worth of the citizens’ votes.
The ideology implies that the state will expect negative voting attitudes from its residents. Adverse voting intentions develop when the desired actions are not performed. Politicians may not achieve high votes when they underperform their obligations. The theory assumes that the public is mainly pleased by developmental activities promised through political agendas. The other assumption is that the government is influenced to spend by district representatives.
Expenditures illustrate that state government is considerate of citizens’ views. Intents to vote are formed when political leaders attain society goals. People value the voting process because their problems will be addressed. The explanation reveals that theoretical expectations from the variables are based on a causal relationship. The causal approach can affirm the hypothesis, which outlines that government spending impacts voting. Visualization of the two variables helps in quantitative analysis of the gathered data.
Visualization of My Variables
- Government spending
- Voting intentions
- Linear Regression Model
- Variables Coefficients
Table 1. Linear Regression of Voting Intentions
Discussion of the Empirical Relationship
Relationship between Voting Intentions and Government Spending
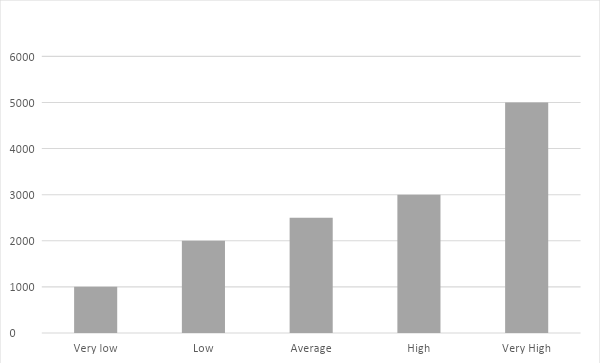
The empirical relationship has been established using the least-squares method of linear regression. The results presented a higher intercept level between government spending and voting intentions. Notably, the model shows that voting intentions are above the average level. The correlation is significant as it aligns with the theoretical expectations of both variables. Voting intentions vary with respect to government spending, such that the higher the expenditure, the more they desire to vote. To be more exact, figure 1 reflects these relationships, whereby individuals with very low motives to vote are impacted by government spending within their region.
The government engages in minimal interventions when expenditure on social amenities is low. For instance, figure 1 shows that reduced funds at $1000 influence the nation to spend less on the budget. Voting intentions among citizens are then impacted towards the lowest possible level. Changes are realized when the government starts to increase its allocations to establish amenities. The graph illustrates that more spending satisfies voters who become motivated to engage in voting exercises.
The Organization of the Variables within the Paper
The intercept coefficient rises as both variables change in an upward direction. The graphical plotting matches the tabulated results. Interception of the y- and x-axis occurs such that a more significant percentage of voters are pleased by government spending. Y-axis’ data is gathered from the graph itself, using the method of denoting to accumulate the results of government spending. In turn, the slope is determined, using the dissimilarity between the two variables, voting intents and expenditure values. Consequently, run values are further included in the linear regression equation in order to calculate the intercept values from the graph. Table 1 provides the outcomes after the values are placed in the equation.
The voting intent value is gained based on the coordinates of the intercepts. Voting intentions reached an above-average level because the gradient was upward. Declining gradients would imply that the relationship between voting intents and government spending is insignificant. For instance, a percentage below the average level indicates that a high percentage of people are likely to disapprove of voting when the government does not spend on social amenities. Therefore, having analyzed the aforementioned statistics, it is fair to claim that government fund allocations considerably influence the voting intentions of the citizens.
Conclusions
The presented data supports the paper’s hypothesis that spending influences voting intents within a state. The p-value was real, indicating that the null hypothesis has a low possibility of being accepted. The null hypothesis for the variables would be that government spending has no significant influence on an individual’s decision to vote. Statistical evaluation of data does not conform to the claim. Implications of the findings denote that theoretical perspectives can be achieved in real situations. Governments should progressively invest in social developments to influence people to vote. Correlational changes will be realized upon altering one variable, whereby the coefficient becomes positively impacted.
References
Ariga, Kenichi. 2022. “POL232 R Handbook 4 Bivariate Analysis.”
“POL232 R Handbook 5 Bivariate Analysis (2) Simple Linear Regression.” 2022.
“Descriptive Statistics for Multivariate Analysis. Multiple Linear Regression.” n. d.
Stephenson, Laura B., Allison Harell, Daniel Rubenson, and Peter John Loewen. 2019. “Canadian election study—Online survey.”