Introduction
It is worth acknowledging that the information environment of society has undergone significant changes over several decades. Whereas previously, the quantity and quality of information media was limited to printed newspapers, radio, or human-to-human communication, the modern development of technology has led to a tremendous expansion of the media landscape. Social media, online publications, podcasts, videos, and web magazines have replaced traditional ways of communicating material and have become the mouthpieces of a great deal of human consumption.
In other words, the consumer of the 21st century has at their disposal a huge number of options for various sources of information, which, however, may not always be reliable. In particular, this phenomenon generates the effect of controlling the masses of people who do not have developed critical thinking or analyzing accurately. As a result, certain cohorts of the population exhibit a strong trust in information carriers without even trying to verify the published material.
In this regard, it is of particular research interest to discuss the statistical patterns found between the given criteria. It is important to make sure that the information published has all the quality criteria and really claims to reflect the real agenda.
For this reason, this research paper chose an online journalistic article, narrating some of the patterns found in the 2012 U.S. presidential election. Specifically, this paper tests the nature of the relationship between religious people attending church services and the votes cast for Obama in the 2012 election. It is necessary to test whether more religious people were actually inclined to cast their votes for Barack Obama, or whether similar material is a particular form of propaganda aimed at shaping certain attitudes among people of faith. Thus, the goal of this research paper is a rigorous critical evaluation of the proposed journalistic article.
Brief Description of the Material
The selected article was a post-election analysis supported by statistical research published by the Pew Research Center. First of all, it should be noted that the author presents the reader with the problem by introducing a new term, namely “nones.” This word, according to the author’s interpretation, refers to all those cohorts of people who do not belong to a particular religious group but who are generally religious people.
Thus, it is incorrect to assume that nones characterize citizens who completely reject spiritual life and are traditional atheists. On the contrary, the author specifically notes that this group of people have some religious beliefs but do not tend to categorize their faith. Assessing the average portrait of the ordinary none, Halloran (2012) wrote that they tend to be represented by younger and liberal-minded society members. Moreover, their political importance has become comparable to that of white evangelicals, traditionally a substantial and weighty voter group.
In a brief discussion, it is worth noting that the magazine article provides numerical evidence of the priority of votes cast for Barack Obama over those cast by traditional Catholics or Protestants. It should be recalled that in the fall 2012 U.S. presidential election, the decisive struggle was between Democrat Barack Obama and Republican Mitt Romney. In a number of states, the nones’ votes were decisive for the Democrat’s victory. The most appropriate way to visualize the statistical data presented by Halloran is the summary Table 1, which greatly simplifies the perception of the proposed material and, moreover, allows to identify some regularities for the data presented.
Table 1. Statistical information about the prioritization of certain religious groups in the 2012 U.S. presidential election: C – Catholics, P – Protestants, N – nones (Halloran, 2012)
Analysis
First of all, it should be recognized that the author’s style as set forth in the journalistic article presented is highly persuasive so that even a trained reader can believe the data offered. There is no doubt that a text with no numbers, but only strict facts, would have raised more research questions about the source of the material and the surveys on which Halloran was guided. For this reason, it was right for the author to indicate not only specific numerical characteristics for the individual, most fluctuating electoral states but also to attempt to assess such outcomes qualitatively. Furthermore, the author stated that the use of political techniques targeting this group of nones is an effective strategy for future election campaigns, as it already produced positive results in 2012 and likely allowed Obama to remain in the White House for another four years.
In her article, Halloran refers to data from the Pew Research Center statistical study, which evaluated in detail the phenomenon of “nones” and analyzed some trends. For instance, it was claimed that by 2010, 25 percent of Millennials in the U.S. belong to this religious group, an increase of 20 percent over Generation X and 13 percent for baby boomers. In other words, one can predict that the proposed data shows a decline in Christianity in the U.S. This is easily verified by examining more current data: as of 2015, the number of millennial nones was between 34 and 36 percent (Shermer, 2018). Thus, there is hardly any manipulation of the data here, and it truly reflects reality.
On the other hand, the paper provides detailed information regarding electoral trends in the 2012 polls. As Table 1 shows, Barack Obama was able to win an absolute majority of nones’ votes in all swing states, a substantial margin over what was characteristic of the Romney campaign. Nevertheless, the qualitative assessment of the data that Halloran described for the reader is critical. According to the text of the article, the number of nones voters who voted for Obama was a specific percentage of the total number of voters in a given state: careful data are presented in Table 2.
Table 2. Summary of the number of people who voted for Obama (Halloran, 2012)
Consequently, according to the information given, although the Democrat was able to gain 47% of nones in Ohio, this represented only 12% of the total electorate. Considering the total number of electors in Ohio in 2012, this percentage was 676,005 believers who voted for Barack (“Voter turnout,” n.d.; “County voter,” 2012; “Registration,” n.d.). On the other hand, this means that 762,304 faithful voters did not vote for Obama: supporting calculations for Ohio are presented in Equations 1-2.
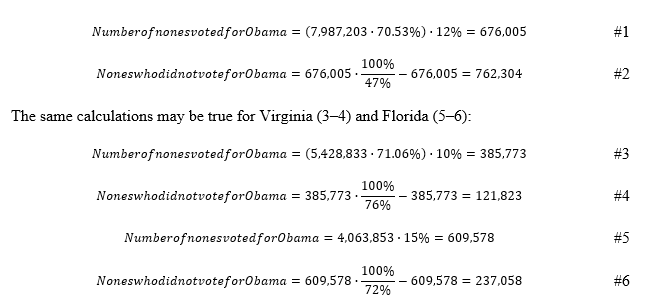
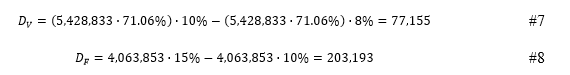
To summarize the calculations, according to the reporter, Obama was able to get 676,005 nones’ votes in Ohio, 385,773 in Virginia, and 609,578 in Florida. Perhaps, this concentration of votes of a certain group allowed Obama to win in each of the mentioned states. However, of heightened interest is the critical evaluation of the proposed data in comparison to other sources. In particular, according to Silk (2012), the number of nones belonging to the electorate differs slightly from the numbers provided by Halloran. Thus, these numbers are 10% for Florida, 8% for Virginia, and 12% for Ohio. Hence, the data offered by an outside source generally show a lower number of voters of a particular cohort for two of the three states.
It is worth noting that there are two potential answers to this inconsistency. First, it is possible to accept the apparent difference in percentages as an error caused by different analysis techniques. For instance, an insignificant discrepancy in percentages (only a few percent for each of the two states) could be due to a problem in interpreting the data or a calculation error. On the other hand, the inconsistency could indicate a deliberate overreporting by Halloran in order to demonstrate a more convincing victory for Obama among nones.
If one follows this scenario, one might assume that an unprepared none-reader who studies the article will decide to act on the majority opinion by casting their vote for the Democrat next time. It is fair to note, nonetheless, that the discrepancy between the numbers is not that significant and is 77,155 and 203,193 votes for Virginia and Florida, respectively (Eqs. 7-8).
Conclusion
In summarizing the results of the critical evaluation presented in this paper, it should be noted that the level of public confidence in information published in newspaper or magazine sources is an important issue for discussion. When facts are deliberately distorted or interpretive errors are made, some sources can mislead readers by imposing incorrect judgments and conclusions. This study evaluated a Halloran’s magazine article in which a journalist described statistical patterns in the 2012 U.S. presidential election among religious groups and nones in particular. It was shown that the numerical inclusions in the article do increase its persuasiveness and allow for its own calculations that can be evaluated when compared to other sources.
In addition, the data presented were found to differ slightly from what might be found when examining third-party materials, which could indicate either measurement errors or a deliberate decision to mislead the reader. An important result of this paper was the answer to the question posed about the nature of the relationship between religious people and votes cast for Obama. It was shown that the electoral share was significantly higher for the group of nones, probably allowing the Democrat to continue his presidential term for another four years.
References
County voter registration by party as 2012. (2012). Web.
Halloran, L. (2012). Add this group to Obama’s winning coalition: ‘Religiously unaffiliated’. It’s All Politics. Web.
Registration/turnout reports. (n.d.). Virginia Department of Elections. Web.
Shermer, M. (2018). The number of Americans with no religious affiliation is rising. Scientific Americans. Web.
Silk, M. (2012). A religious breakdown of 12 battleground states. RNS. Web.
Voter turnout in general elections. (n.d.). Frank LaRose. Web.