Countries engage in bilateral trade relationships based on the interplay of serval factors. A company should be able to produce a particular product in quantities that meet or satisfy the local demand before resorting to exportation. Besides, the country in question might need to weigh the cost of producing the product against what it would cost to import the goods or services. It might also be necessary to import a certain product from the target-market country in a bid to achieve a trade equilibrium state. The Ricardian Model of trade offers an excellent way of analyzing and explaining trade patterns. A critical analysis of the international trade relationship between China and Australia using the Ricardian Model reveals that the exchange of toys from China and coal from Australia is a perfect manifestation of the comparative advantage concept.
The Ricardian Model by David Ricardo is an ideal mercantilist-based tool used to analyze bilateral trade relationships. The model incorporates several assumptions, such as perfect competition and product homogeneity across countries (‘Topic 1-Comparative advantage and Ricardian model,’ 2020). Countries in the bilateral trade relationship are presumed to use the same factor of production to produce two types of products. Notably, the model assumes that the goods are homogenous across the countries (‘Topic 1-Comparative advantage and Ricardian model,’ 2020). Regarding the China-Australia bilateral trade relation, toys from China and Coal from Australia are presumed to be homogenous, and the markets are defined by perfect competition. Labour is the factor of production considered in this analysis, with Australia being the home country and China the foreign one.
Australia is a major producer and exporter of thermal coal to various world markets. In 2019, the country produced and exported 208 million tonnes worth US$26 billion with approximately 20% or $5.2bn of this going to China, making China (Tradingeconomics.com, 2020). Ostensibly, China has become a key target market for Australia’s coal due to the country’s fast-growing energy demand. Liu (2020) notes that China’s demand for coal is likely to increase with a near-exponential trend because approximately 400 tonnes of capacity are under construction. However, Australia’s imports from China totalled $US56.95 billion in 2019, with toys making up US$1.82 billion of the imports (Tradingeconomics.com, 2020). Apparently, Australia imports a large assortment of manufactured products from China. These range from furniture and steel to articles or apparel and plastics. Toys make a small share of the imports compared to furniture that makes up to US$3.31 billion of Chinese imports in Australia (Tradingeconomics.com, 2020). These figures are a clear pointer that Australia and China are close business allies.
In Australia, the marginal product labour (MPL) for the production of coal and toys at home is expressed as MPLc = 5 and MPLt = 2.5, respectively. An additional worker in the coalmines could produce additional five units of coal, whereas an additional worker in the toy production industry could trigger an increase in production equal to 2.5 units of coal. Assuming that Australia’s workforce is 20, total coal and toy production would be 100 and 50 respectively. The MPL for the two products gives the production possibility frontier (PPF) for the two countries. The PPF slope incorporated in Figure 1 overleaf shows the value of toys required for every coal unit given out at the x-axis and y-axis intercept points.
Australia could either produce 100 units of coal or the equivalent of 50 toys if all potential workers were employed. The PPF slope links the two points on the x-axis and y-axis, respectively. The slope, which is a negative value (-0.5), depicts the opportunity cost of coal. It is equal to the ratio of MPL values for the two products: coal and toys. The incorporation of the indifference curves to the PPF, which is the graphical expression of the Australian supply side, is used to express the home country consumers’ preferences towards coal and toys, as shown in Figure 1 below. Markedly, the coal and toy markets must attain equilibrium at home, a scenario called Autarky, before indulging in international trade.
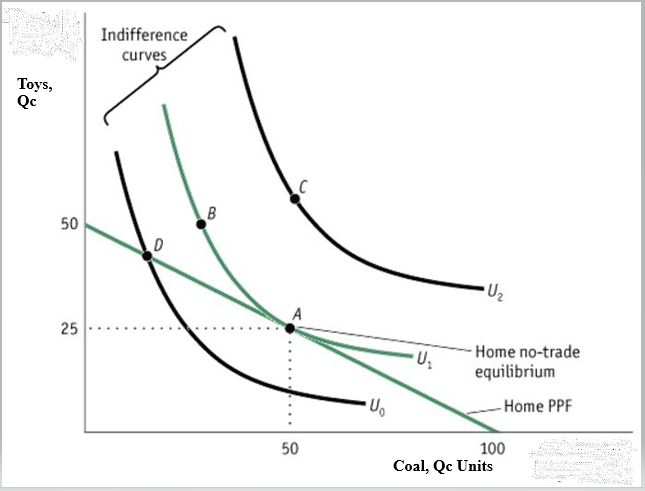
Points A and B on the indifference curve give home consumers the U1 utility level. Point A denotes the no-trade equilibrium, which is the highest level of home utility. Australia would not need to import or export at this point. Point D would give a lower utility much as it lies within the PPF curve. Like D, point C is unrealistic and would not be preferred because it is not on the PFF curve. Usually, attaining a point outside the PPF curve requires a country to participate in international trade (Moloi and Marwala 2020). As such, Australia must weigh the cost of producing the two products against the cost that the same products could be imported, which culminates in the concept of opportunity cost.
Essentially, Australia has a sufficient supply at point A, where the indifference curve touches the PPF slope. However, this situation could only be attained if the labour market in Australia met the conditions of perfect competition. Unfortunately, this is seldom the case in any industry because of wage variations across sectors. As such, Australia resorts to the capitalisation of coal production, which helps shift the indifference curve up to point C. Australia has the capacity to produce coal at a relatively lower cost and in large quantities due to the presence of coal deposits. Rather than settling for the Autarky at point A, Australia strives for point C that offers a competitive advantage for coal. Hence, Australia is better positioned to capitalise on the production of coal at a lower opportunity cost instead of struggling to produce both coal and toys.
Reference List
‘Topic 1-Comparative advantage and Ricardian model’ (2020) [PowerPoint presentation]
Liu, K. (2020) ‘Chinese influence in Australia: What do financial markets tell us?’ East Asia, pp.1-20. Web.
Moloi, T. and Marwala, T. (2020) ‘Comparative advantage,’ in Artificial intelligence in economics and finance theories., Cham: Springer, pp. 21-32.
Tradingeconomics.com. (2020) Australia imports from China – 1988-2019 DataData. Web.