Region Profile
The Emirate of Dubai is a semi-autonomous member of the United Arab Emirates (UAE). It is situated in the south-eastern corner of the Arabian Peninsula, near the entrance to the Persian Gulf. The emirate’s capital city of Dubai is also its main population and economic center. Dubai’s natural endowments are modest by comparison with many of its neighbors. Although oil was discovered in the 1960s, this resource has mostly been exhausted. Dubai is also relatively poor in cultural heritage sites and beaches. However, its convenient location between Europe and much of Asia allowed Dubai to emerge as a transit hub from the 19th century onwards, attracting trade and tourism (Al Sadik, 2016). While only occupying 3,885 square kilometers, Dubai is home to over 4 million people. The emirate enjoyed a long period of security, first as a British protectorate and then within the UAE. It has leveraged its stability and limited endowments to achieve spectacular growth, creating a diversified commercial economy. Dubai is an absolute hereditary monarchy ruled by Emir Mohammed bin Rashid Al Maktoum, who also serves as the Vice President and Prime Minister of the UAE.
Economic Performance
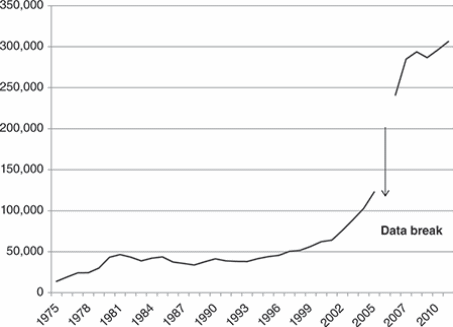
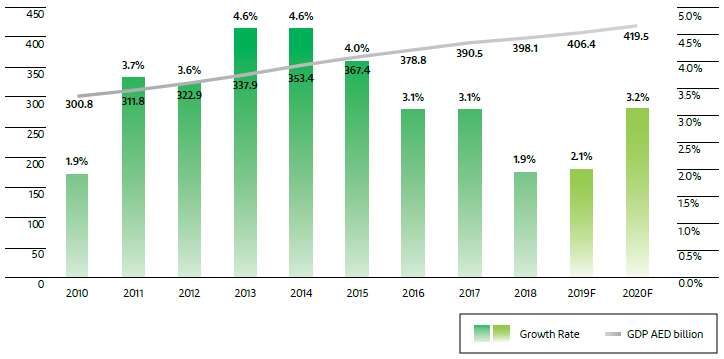
Figure 1 demonstrates that Dubai’s economic growth in recent decades has been both dramatic and uneven. As Al Sadik (2016, p. 25) notes, its real GPD “grew by a factor of almost nine” in the years 1975-2005. While slowed by the collapse in oil prices in 1986, it accelerated in the 1990s and boomed in the 2000s. The global financial crisis of 2008 triggered a contraction, but as shown in Figure 2, this was followed by several years of impressive expansion. The most recent deceleration in real GDP growth can be mainly attributed to a global economic downturn caused by political and macroeconomic tensions and instability in many parts of the world. In the light of the COVID-19 pandemic, the Department of Economic Development’s (2019, p. 28) forecasts for renewed acceleration in 2020 may no longer apply.
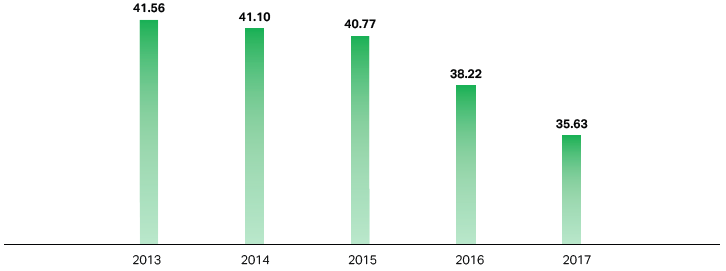
The ongoing decline in real GDP per capita revealed in Figure 3 may be explained by a combination of GDP deceleration and rapid population growth. Overall, Dubai’s economic performance in recent decades has been impressive, but the unevenness of its improvement hints at structural problems that will be explored below.
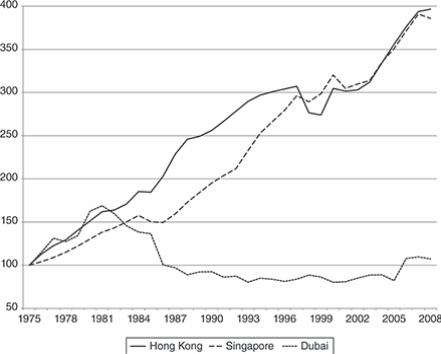
One particular problem faced by the economy is the low average productivity of labor in Dubai. This aspect of productivity is measured by average output per working-age person (Al Sadik, 2016, p. 27). As seen in Figure 4, Dubai has significantly lagged behind such otherwise similar rivals as Singapore and Hong Kong in this regard. This deficiency may be a product of inefficient use of resources and insufficient adaptation of technological advances, as well as excessive reliance on unskilled migrant labor. A qualified native workforce is needed to take full advantage of the economic opportunities created by technological and institutional development. This state of affairs hinders Dubai’s long-term economic growth and reveals a major limiting factor in its attempts to foster innovation.
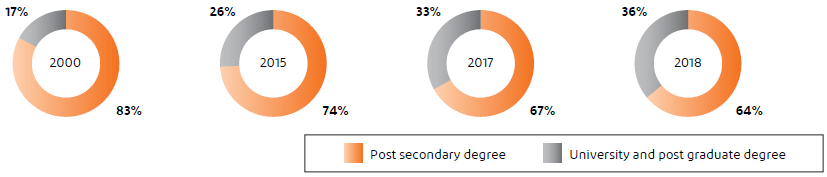
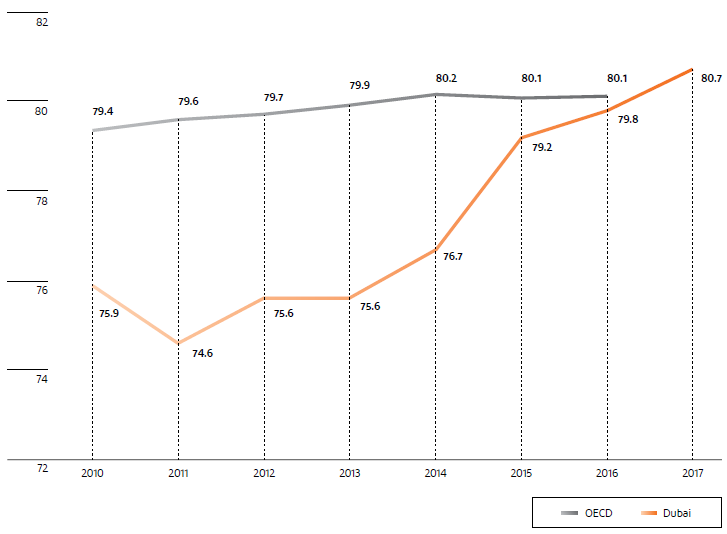
Dubai’s prosperity has gone hand in hand with substantial improvements to its population’s standards of living. Those improvements can be observed in the example of higher education attainment and average life expectancy, shown in Figure 5 and Figure 6, respectively. Such steady progress reflects productive investments in human capital that should help improve individual productivity, secure social harmony, and enable sustainable economic growth. The increase in social measures is also an essential factor in attracting more qualified human resources from abroad, especially from elsewhere in the Arab world.
Composition of the Economy
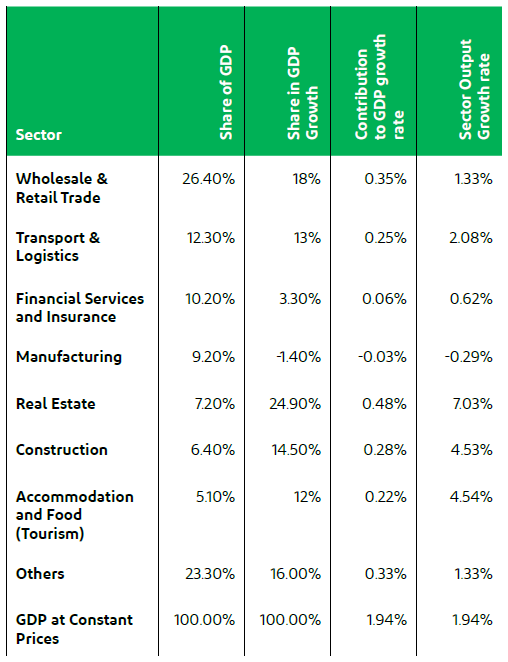
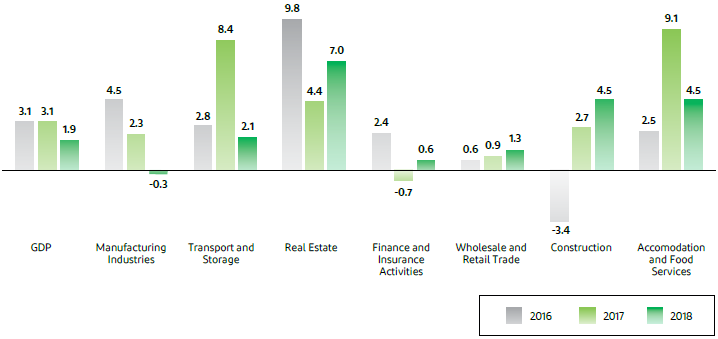
As detailed in Figure 7, 76.8% of Dubai’s real GDP in 2018 came from seven sectoral clusters, five of which (trade, logistics, finance, real estate, tourism) belong to the service sector. Figure 8 shows the significant variability in different sectors’ growth rates over the last few years. The recent downturn in manufacturing reflects a decline in external demand (Department of Economic Development, 2019, p. 29). While real estate and construction have been among the main contributors to the economy, their future viability as primary drivers of growth appears dubious due to their non-tradable nature and the risk of outpacing demand. Tourism, logistics, and trading all benefit from being Dubai’s “traditional” clusters, with well-established interconnectivity and strong place branding enabling sustainable growth (Hafeez et al., 2016, p. 398). The emirate’s successful positioning as a Persian Gulf finance hub and a leader in Islamic finance underpins the long-term strength of its financial cluster, which is vital to the development of other clusters. The emerging creative cluster is most directly related to the tourist cluster, but benefits from the support of all “traditional” clusters and finance.
Regional Competitiveness
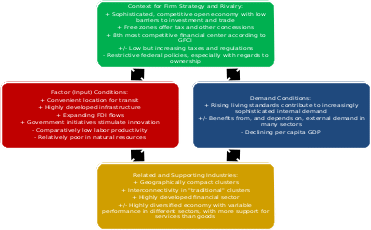
Figure 9 sums up the main strengths and weaknesses shaping the emirate’s competitiveness, as seen through the lens of Michael Porter’s diamond model. The Global Financial Centres Index (2019) (cited in Department of Economic Development, 2019, p. 12) ranks Dubai as the 8th most competitive of 104 financial centers – far ahead of all MENA rivals. Foreign direct investment (FDI) inflows rose to AED 38.5 billion in 2018, forming a 41% increase from 2017 and contributing 9.7% of the GDP (Department of Economic Development, 2019, p. 13).
Aside from some restrictive federal laws (see below), Dubai has been traditionally very business-friendly, shaping the emergence of a highly competitive economy with multiple interconnected clusters (Mishrif and Kapetanovic, 2018). Its sophisticated infrastructure is another product of the emirate’s long trading legacy. The government’s efforts to foster innovation by systematically promoting innovative clusters with loosened regulations help attract more business to the emirate and redress its economic productivity deficiencies. Though postponed to 2021 due to the COVID-19 pandemic, Dubai Expo 2020 still serves as another indicator of international recognition of Dubai’s economic accomplishments.
Macroeconomic, Political, Legal, and Social Context
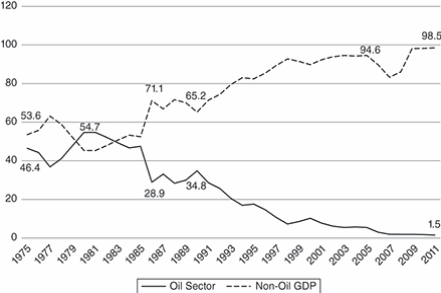
The most striking feature of Dubai’s macroeconomic development has been its successful diversification from a mostly oil-based economy to one that involves a wide variety of goods and services. As shown in Figure 10, the oil sector’s share in Dubai’s GDP fell from 54.7% in the early 1980s to 1.5% in 2011 and remained in that area since. Instead, Dubai focused on such areas as trade, tourism, and financial services, using its trading legacy and the profits from its shrinking oil reserves to accelerate its development. This transformation did not mean complete independence from oil, as Dubai’s economy remains closely connected to that of its oil-rich neighbors (Mishrif and Kapetanovic, 2018).
Much of Dubai’s prosperity derives from external trade and investment in the Persian Gulf region, so oil price fluctuations still exercise a substantial indirect influence (Department of Economic Development, 2019). Nevertheless, its economy is more resilient due to having a wide variety of sources of revenue. Dubai was able to defy the “resource curse” of overdependence on natural resources distorting economic development and leading to worse long-term outcomes.
Dubai’s macroeconomic development is impossible to detach from the region’s political and legal circumstances. As a member of the UAE, Dubai enjoys considerable internal autonomy but is still subject to federal legislation such as customs duties and high-level business regulations (Mishrif and Kapetanovic, 2018). However, the emirate’s government can introduce significant exemptions to the federal rules. A notable example is the creation of more than 30 Free Zones, in which business regulations are loosened and the federally-mandated 49% foreign ownership maximum is waived. On the whole, though, Dubai’s policies align with those of UAE, including pro-business policies such as the absence of trade barriers and exchange controls, low taxes and tariffs, and widespread regulatory exemptions.
The other noteworthy political factor is the role played by the absolute monarchy. The active role played by the state in guiding economic development is enhanced by the monarchy’s prestige and capacity for streamlined decision-making. The ruling Al-Maktoum dynasty has been historically open to trade. Al Sadik (2016, p. 19) dates this tendency back to the emirate’s foundation in the 1830s, describing one of its early rulers as “the most pro-business leader on the coast of Oman”. A legacy of attracting a diverse, cosmopolitan group of merchants and integrating them into governance as advisors and financial backers has remained influential into the 21st century (Mishrif and Kapetanovic, 2018). The willingness and ability of the government to cooperate effectively with the business community over the long-run have been decisive in transforming Dubai’s economy. It has also helped ensure business confidence in the emirate during critical points in its development.
Despite its considerable strengths, Dubai’s macroeconomic structure also possesses weak points that were exposed during the 2008 crisis. In addition to the aforementioned low productivity of labor, it is also especially susceptible to global cyclical phenomena due to the limitations of its monetary and fiscal policy. By pegging the UAE dirham (AED) to the US dollar to reduce volatility, the UAE federal government has effectively exported America’s monetary policy (Al Sadik, 2016).
The United States’ quantitative easing program in 2008, which came at a time when the UAE’s economy would have benefited from a tighter monetary policy, demonstrated the downsides of this approach. In Dubai, this policy led to unsustainable credit growth and a debt crisis that was only resolved with Abu Dhabi’s financial support. The absence of countercyclical fiscal instruments that could cushion the shock exacerbated the situation further. This vulnerability was partly alleviated by the introduction of a 5% value-added tax (VAT) in 2018 (Department of Economic Development, 2019, p. 38), though widespread exemptions have limited its effectiveness.
Dubai’s unusual demographic situation acts as the single most influential social factor. The Dubai Statistics Center (2018) (cited in Department of Economic Development, 2019, p. 156) estimate that, as of 2018, citizens comprised under 8% of Dubai’s population. The vast majority of people in the emirate are expatriates, many of whom are unskilled migrant workers. A further social disparity is caused by the fact that while traditional tribal mechanisms support Emirati citizens, the expatriates have no comparable social safety net (Mishrif and Kapetanovic, 2018). The ambiguous social status and prospects of the expatriates, coupled with their importance to the economy, complicate the emirate’s ability to utilize its human capital.
Reference List
- Al Sadik, A.T. (2016) ‘Macroeconomic overview’, in Al Faris, A. and Soto, R. (eds.) The economy of Dubai. Oxford: Oxford University Press, pp. 19-48.
- Mishrif, A. and Kapetanovic, H. (2018) ‘Dubai’s model of economic diversification’, in Mishrif, A. and Al Balushi, Y. (eds.) Economic diversification in the Gulf Region, volume II: Comparing global challenges. Singapore: Palgrave Macmillan, pp. 89-111.
- Department of Economic Development (2018) Dubai economic report 2018. Web.
- Department of Economic Development (2019) Dubai economic report 2019. Web.
- Hafeez, K. et al. (2016) ‘The role of place branding and image in the development of sectoral clusters: the case of Dubai’, Journal of Brand Management, 23(4), pp. 383-402.