Significance of Turnout, Inclusion, and State Distribution
Identifying anomalies and trends in the electoral process is imperative to understand the causes and consequences of certain events. The election that led to the fall of Donald Trump is an example of some features that need to be studied. Measures of turnout, inclusion, and state distribution are reliable indicators that can indicate specific patterns that help explain victory.
Statistics to determine significance differences should also be considered so that the relationships between variables show sufficient directionality. States where senators were less inclusive were more likely to support Trump in the election.
Crosstabulation Analysis and Findings
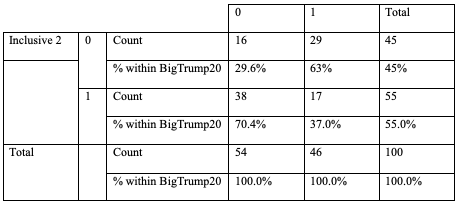
Rows of different values sorted into separate rows and columns can allow the analysis of high-quality representative data. Based on them, it will be possible to establish combinations of some categories useful for qualitative future values (Humprecht et al., 2020). Crosstabulation analysis shows a clear and significant separation between indicators 0 and 1, which indicates the need to search for an anomaly. We can say that the independent variable (BigTrump20) significantly influences the dependent variable due to the large discrepancy in the inclusiveness parameters.
This is evident in the fact that in states where Trump won, the number of inclusive senators who posted relevant ads on their platforms was significantly smaller (Holmes, 2021). The likelihood of differences is significant since the victory in states with less inclusive senators was 63% (Table 1). At the same time, when most government officials posted any material related to inclusion and accounted for 70.4%, this showed a loss in these states. Thus, we can say that people voted for Trump more willingly in areas where the dependent variable was smaller.
Bivariate Crosstabulation: Establishing Relationships Between Variables
Bivariate crosstabulation is an essential statistical technique to find possible relationships between two variables of interest. Creating a table using this method can help establish relationships between various variables that can affect the actual situation. They are subsequently implemented due to the knowledge obtained during the analysis (Grossman et al., 2020). Presenting two values in different cells can help compare the necessary indicators that will affect the qualities of critical future circumstances (Hughes et al., 2014).
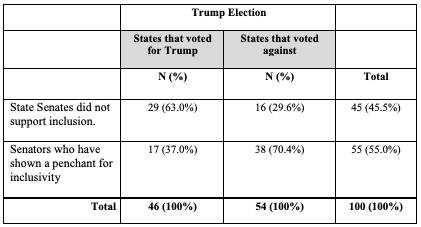
The bivariate crosstabulation in Table 2 confirmed the hypothesis that a direct comparison of the results in the columns indicates a relationship manifested in the example of states that voted to support Trump in the elections. The indirect relationship in this context is that states with more significant support for inclusion did not favor a given candidate due to opposing views. In particular, the inclusion variable was not supported by those states where the majority of voters voted for the candidate, that is, 63%. At the same time, the same voting actions were observed in 37% of states with an active inclusion policy. This reveals that the vast majority of states with inclusive systems (70.4%) did not vote for Trump.
A static test for use in determining the values of related categories that can determine the actual values and their importance in the context of policy research. Categories without internal order that are nominal variables can be represented to produce differences in outcomes under contingency conditions (Bohrnstedt & Knoke, 1994). A Pearson’s Chi-square test [X2 = 11.205, p <.001] confirms the previously discussed results, indicating a connection between states’ inclusion policies and how they voted in elections.
Pearson’s Chi-Square Test and Its Implications
The probability that a cross value forms a relationship is less than 0.01%, making it impossible to assume that the values indicate a match that did not lead to results. The Phi study also showed that the relationship between the mentioned indicators is relatively high and cannot be random. This value is equal to 0.335, which shows a positive trend that reveals the relationship between the representativeness of state senators, their preferences regarding the political course, and how this influenced voters in a particular district. The effect size is thus also significant since the relationship is highly positive.
Implications of Findings for Electoral Analysis
The findings in this study have real-world implications for understanding power dynamics within electoral states and how advanced interests ultimately influence outcomes. At the same time, research has some limitations related to incomplete coverage of senators, which narrows the possible results and applicability. However, considering and taking into account voters’ preferences directly may, in the future, affect how politicians can shape their influence strategies based on the analysis of the contingent and preferences (Jasanoff, 2022).
Limitations and Further Research Directions
Substituting variables, when interfering in the analysis, can, at the same time, lead to different results that will distort the significance of the results reflected in the original data of qualitative data analysis. Independent and dependent variables can affect the final data obtained from the crosstab and the values occurring. Further research should aim to represent all relevant variables qualitatively.
References
Bohrnstedt, W., & Knoke, D. (1994). Statistics for social data analysis (3rd ed.). Peacock Publishers, Inc.
Grossman, G., Kim, S., Rexer, J. M., & Thirumurthy, H. (2020). Political partisanship influences behavioral responses to governors’ recommendations for COVID-19 prevention in the United States. Proceedings of the National Academy of Sciences, 117(39), 24144-24153. Web.
Holmes, S. (2021). Trump’s long shadow. Teoria Politica, (11), 85-99. Web.
Hughes, R. L., Beatty, K. M., & Dinwoodie, D. (2014). Becoming a strategic leader: Your role in your organization’s enduring success (2nd ed.). John Wiley & Sons.
Humprecht, E., Esser, F., & Van Aelst, P. (2020). Resilience to online disinformation: A framework for cross-national comparative research. The International Journal of Press/Politics, 25(3), 493-516. Web.
Jasanoff, S. (2022). The Discontents of Truth & Trust in 21st Century America. Daedalus, 151(4), 25-42. Web.